 1
1Trending this week
The canonical trending list: growth at full weight over rolling seven-day windows. Fast enough to catch a move, slow enough that one viral morning does not rewrite it.
Trending this week: all 2
2 products ranked
1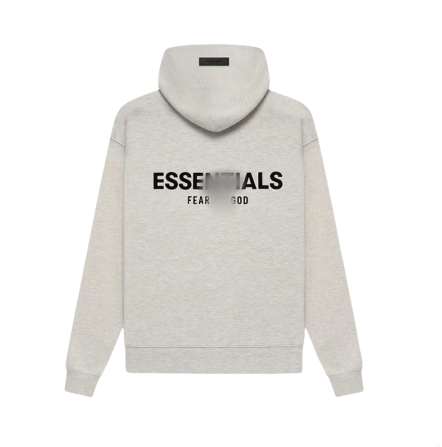 2
2 7-day lens
What this ranking measures
2 products rankedRecomputed continuouslyNever paid placement
Trending here means growth, not size. Each product's saves and views over the last seven days are compared against the seven days before; the ratio between the windows is what ranks, so a small product accelerating beats a big one coasting.
This weekly lens is the balance point of the three windows. The daily view (growth at 1.35x) reacts faster but churns; the monthly view (0.7x) rewards products that keep earning attention for weeks. This is the one we would check first.
Every card above carries its position in this list. Click through for the reviews, the warehouse QC photos and a purchasing-agent cost estimate, because a rank is a starting point and the evidence on the product page is what actually decides it.
The fine print
- Saves carry 60% of the velocity signal, views 40%.
- The composite is 50% velocity, 20% quality evidence, 18% popularity, 12% trust. Quality and verification keep a junk listing from riding a spike to the top.
- A 90-day half-life age decay applies to every product.
- Unavailable listings score zero and are excluded.
Affiliate relationships never touch these rankings. Lantern earns referral fees from some purchasing agents (disclosed on every quote), and none of that revenue can move a product one place in any list on this page.
The other rankings
Each list answers one question well and none of them answers every question. Read two before trusting either.
24-hour lensTrending todayThe 24-hour pulse. Growth weighted 1.35x: reactive, unstable by design.Open Monthly lensTrending this monthGrowth damped to 0.7x. Momentum that lasts weeks, not the spike of the day.Open AccelerationRising fastestPure acceleration. Floors at 1.15x growth and 6 saves this week.Open All-time savesMost savedLifetime bookmarks, counted raw. No adjustment of any kind.Open All-time viewsMost viewedLifetime views. What is famous, not necessarily what is good.Open ConversationMost discussedReviews + comments. Argument counts the same as praise.Open Rating vs priceBest valueRating ÷ log(price), minimum 3 reviews. Cheap that holds up.Open Evidence-weightedTop rated45% quality, 25% trust, 20% popularity, 10% velocity. 6-review floor.Open Just addedNewestStrict submission order. Published on arrival, unproven by definition.Open
Slice it another way
Every category page carries its own trending, best-rated and budget rails, and every tag cuts across the taxonomy.